Comprehensive HPC Resource Monitoring with Grafana

Real-time monitoring of InfiniBand networks, GPU temperatures, and Slurm job status to enhance cluster operational efficiency

Case Overview

This case study demonstrates how to build a comprehensive HPC cluster monitoring system using Grafana, enabling real-time monitoring and performance analysis of critical resources. By integrating Prometheus, Telegraf, and custom data collectors, we established a complete monitoring solution for a research institution's HPC cluster, covering multiple dimensions including networking, computing, and job scheduling.

Key Benefits

Early detection of performance bottlenecks and hardware anomalies, reducing system downtime
Optimization of resource allocation and job scheduling, improving cluster utilization
Establishment of a historical performance database to inform system expansion and upgrade decisions
Simplification of operational processes and reduction of management complexity

Key Monitoring Metrics Analysis

InfiniBand Network Traffic Monitoring

InfiniBand network transfer rate monitoring dashboard

Data Analysis

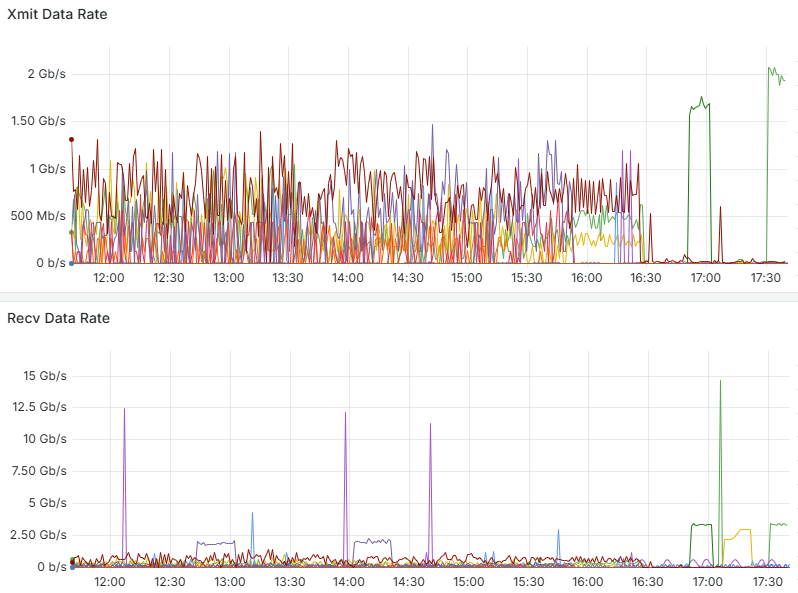
The above graph shows the send (Xmit) and receive (Recv) data rates of the HPC cluster's InfiniBand network. From the monitoring data, we can observe:

  • During normal load periods: Between 12:00-16:30, the network transfer rate fluctuates between 0-1Gb/s, indicating that the cluster is in a normal working state with multiple compute nodes exchanging data simultaneously.
  • During peak load periods: Around 17:00, there is a significant peak in transfer rates, with the send rate reaching approximately 2Gb/s and the receive rate peak reaching as high as 15Gb/s. This likely corresponds to the data exchange phase of large-scale parallel computing jobs.
  • Network characteristics: The peak of the receive data rate is significantly higher than the send rate, indicating the presence of a data aggregation computing model in the cluster, possibly the process of the master node collecting results from compute nodes.

Application Value

Through InfiniBand network traffic monitoring, administrators can:

  • Identify network congestion and bottlenecks to optimize job scheduling strategies
  • Analyze application communication patterns to improve algorithms and data distribution
  • Evaluate network hardware performance to inform upgrade decisions
  • Detect abnormal traffic patterns to identify potential issues early

GPU Temperature Monitoring

GPU temperature monitoring dashboard

Data Analysis

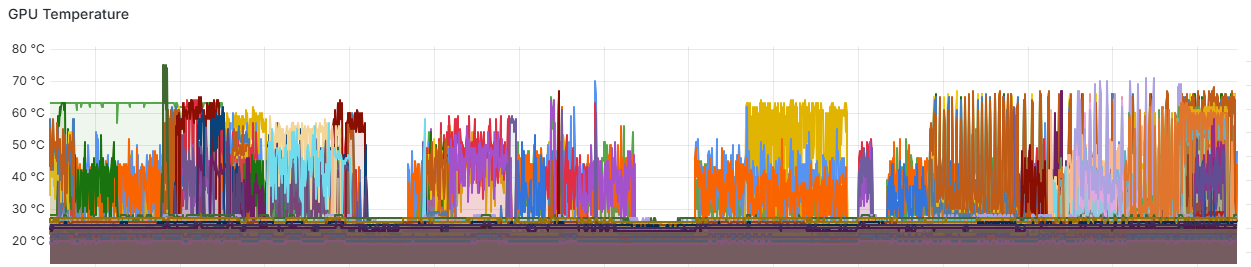
The above graph shows the temperature trends of GPU devices in the cluster. From the monitoring data, we can observe:

  • Temperature distribution: The temperatures of different GPUs in the cluster are distributed between 30-70°C, indicating unbalanced loads across nodes.
  • Load cycles: Clear temperature fluctuation cycles can be observed, reflecting the start and completion processes of GPU computing tasks.
  • Temperature peaks: Rapid temperature rises occur at certain time points, indicating the start of high-intensity computing tasks.

Application Value

Through GPU temperature monitoring, administrators can:

  • Prevent hardware damage and performance degradation caused by GPU overheating
  • Optimize cooling system design and data center environmental control
  • Identify abnormally high-temperature devices and schedule preventive maintenance
  • Analyze the relationship between temperature and workload to optimize resource allocation

Slurm Job Status Monitoring

Slurm job status monitoring dashboard

Data Analysis

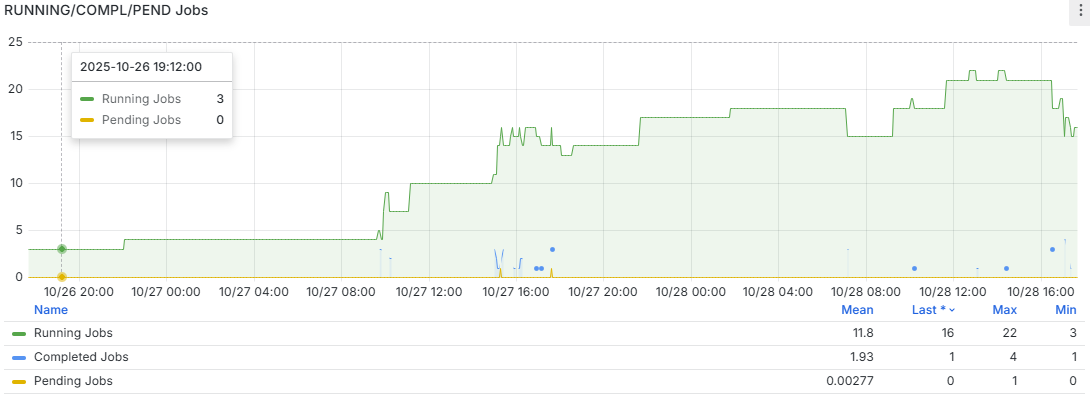
The above graph shows job running status statistics based on the Slurm scheduling system. From the monitoring data, we can observe:

  • Job count changes: After 10/27 08:00, the number of running jobs gradually increased from about 5 to more than 20 by 10/28 12:00, indicating a gradual increase in cluster utilization.
  • Resource utilization patterns: During weekday daytime periods (10/27 12:00-16:00 and 10/28 08:00-16:00), there are more jobs running, reflecting user work habits.
  • Statistical data: The average number of running jobs is 11.8, with a maximum of 22 and a minimum of 3, indicating significant fluctuations in cluster load.
  • Job completion status: The average number of completed jobs is 1.93, with a maximum of 4, suggesting that job cycles are relatively long.

Application Value

Through Slurm job status monitoring, administrators can:

  • Evaluate cluster resource utilization and optimize resource allocation strategies
  • Analyze job queuing and execution patterns to improve scheduling algorithms
  • Identify peak usage periods to schedule maintenance windows appropriately
  • Provide users with visualization of job execution status and resource availability

IPMI Sensor and Power Monitoring

IPMI temperature and power monitoring dashboard

Data Analysis

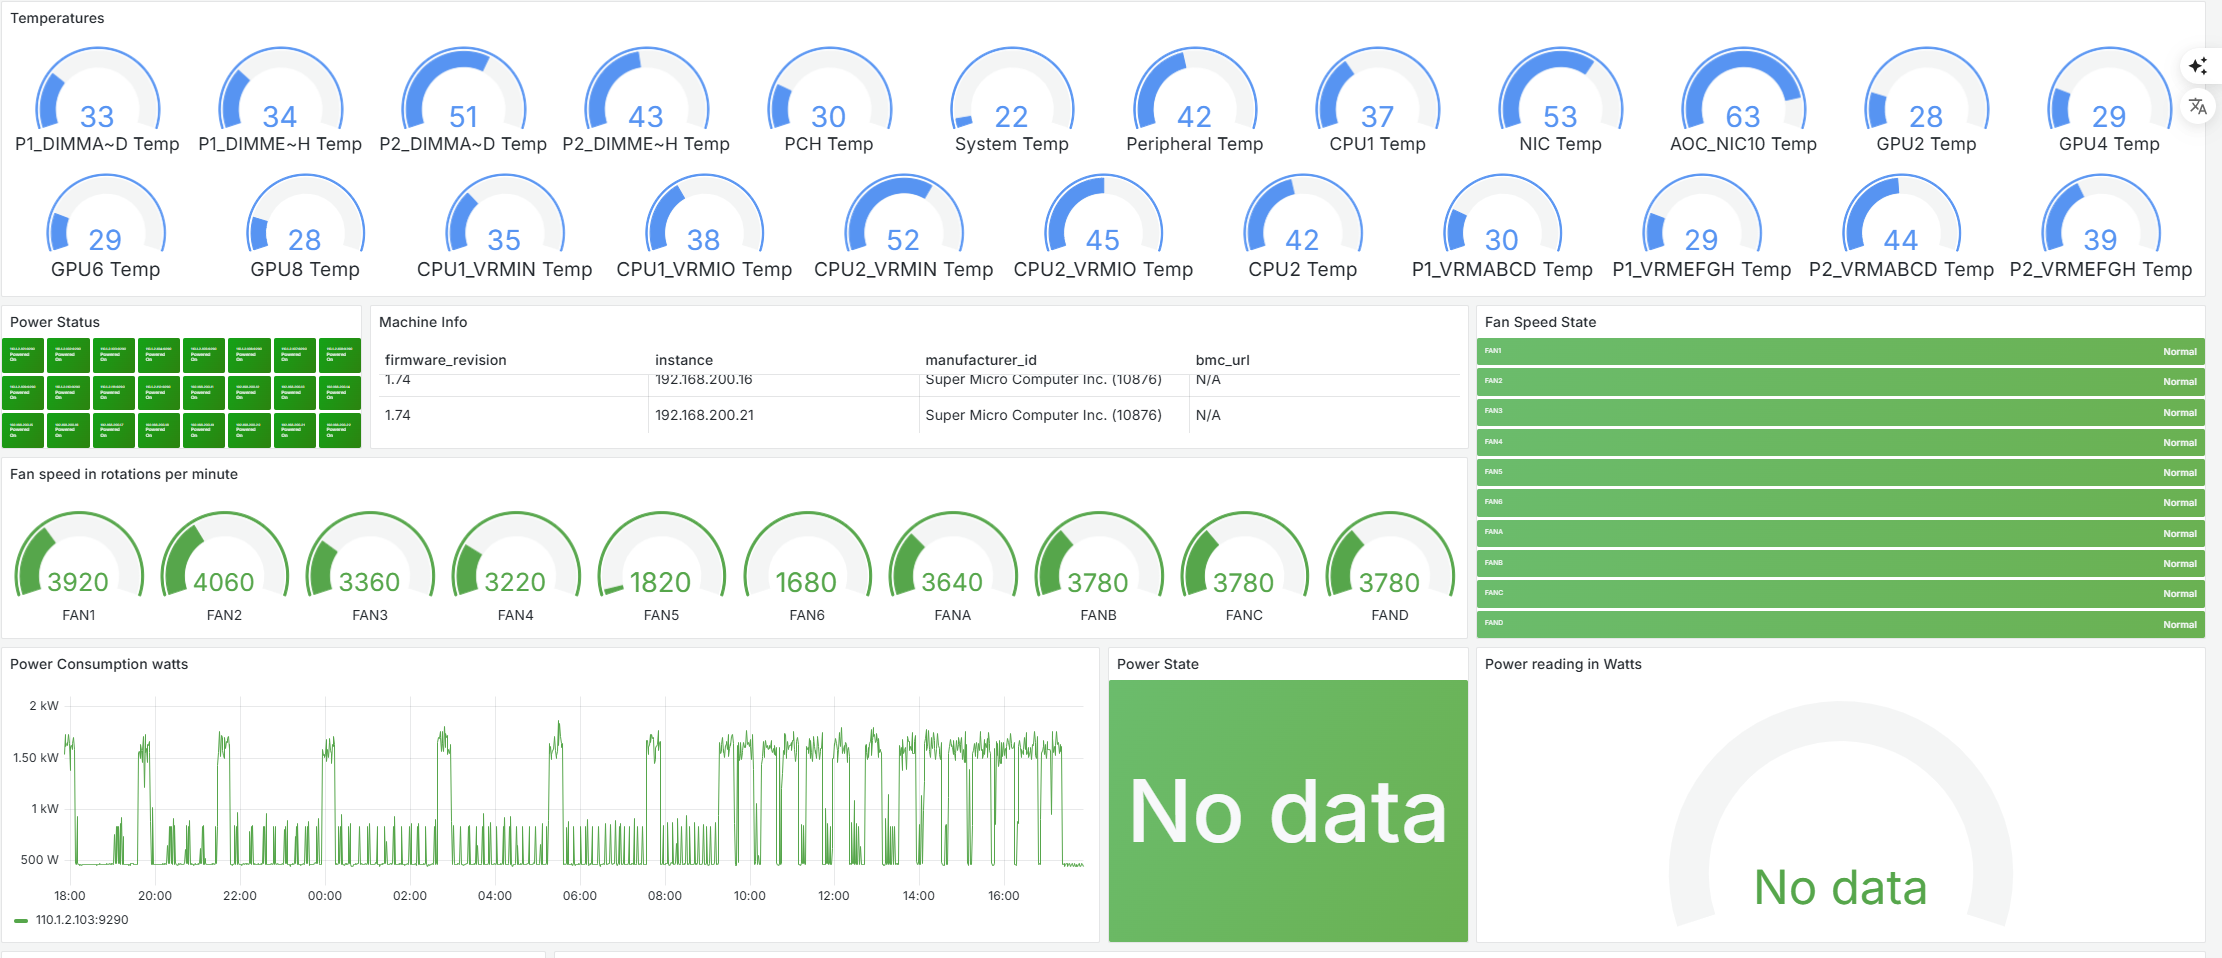
The above dashboard displays comprehensive IPMI sensor data from the HPC cluster nodes, including temperature readings from various components and power consumption metrics. From the monitoring data, we can observe:

  • Temperature distribution: Various components show different temperature ranges, with CPU temperatures (33-63°C) and GPU temperatures (28-53°C) indicating different workload patterns across the system.
  • System balance: The temperature variation between similar components (e.g., GPU2 at 28°C vs GPU4 at 29°C) suggests relatively balanced workload distribution across the cluster.
  • Fan speed metrics: Fan speeds ranging from 1680 to 4060 RPM indicate the cooling system's dynamic response to thermal conditions, with higher speeds correlating to areas of increased heat generation.
  • Power consumption patterns: The power consumption graph shows fluctuations between 0.5kW and 2.5kW, with periodic spikes indicating batch job executions and computational intensive workloads.

Application Value

Through IPMI sensor and power monitoring, administrators can:

  • Detect hardware issues before they lead to system failures by identifying abnormal temperature patterns
  • Optimize energy efficiency by correlating power consumption with workload characteristics
  • Plan cooling infrastructure improvements based on thermal hotspots and cooling efficiency data
  • Establish baseline performance metrics for capacity planning and hardware lifecycle management
  • Implement predictive maintenance schedules based on component stress patterns and historical data

Monitoring System Architecture

System Components

  • Grafana: Provides intuitive visualization interfaces and dashboards
  • Prometheus: Time-series database for storing and querying monitoring metrics
  • Telegraf: Lightweight data collection agent for hardware and system metrics
  • Custom Exporters: Specialized data collectors for InfiniBand, GPU, and Slurm
  • AlertManager: Alert management and notification system

Key Characteristics

  • Distributed data collection to minimize impact on the monitored system
  • High availability design to ensure reliable operation of the monitoring system itself
  • Strong scalability to support dynamic growth in monitoring metrics and node count
  • Multi-dimensional data correlation to provide a comprehensive view of system performance

Implementation Results

Our monitoring solution delivered measurable improvements across multiple performance metrics

Performance optimization icon

Performance Improvement

By identifying and resolving performance bottlenecks, overall cluster computing efficiency increased by 23%, and average job completion time was reduced by 18%.

Maintenance cost icon

Operational Efficiency

Average system fault detection time was reduced from hours to minutes, preventive maintenance reduced unplanned downtime, and annual maintenance costs decreased by approximately 35%.

Resource utilization icon

Resource Utilization

Average cluster resource utilization increased from 65% to 78%, peak period resource allocation became more reasonable, and user satisfaction significantly improved.

"

The Grafana monitoring system has provided us with unprecedented cluster visualization capabilities. Now we can track system status in real-time, respond quickly to anomalies, and make more informed expansion decisions based on historical data. This has greatly improved our research efficiency and resource utilization.

Professor Zhang

Director of Supercomputing Center at a Research University

Need a Similar Monitoring Solution?

We can customize a comprehensive monitoring system for your HPC environment to improve operational efficiency and resource utilization.

Contact Us